Launch day · the spike and the cliff
1,000 launch-day visitors. Zero names.
Nineteen mattered. Meet them.
You get one launch. The upvotes came, the traffic spiked, and the dashboard drew you a mountain followed by a cliff. Who were those thousand people? TribeMap read each one live. 940 came to gawk, 41 explored, 19 read your pricing like they meant it. Those 19 have dossiers.
⚡ Install in minutes. No dashboard archaeology.
The old way
Your dashboard
???
Which of them wanted to buy?
The new way
TribeMap
Same 1,284 visitors. Each one read.
Your dashboard has every number except the one you came for.
Privacy first
We never store IP addresses, and the script never reads what anyone types. No cross-site tracking.
How we handle dataBuilding SaaS since 2016
TribeMap comes from the founders of Upscope, a SaaS company in London and Miami. Its co-browsing product holds ISO 27001 and SOC 2.
Meet the foundersPaste one snippet, go to lunch
Nothing to configure. Free for 7 days, cancel anytime, and pulling the snippet stops it dead.
See pricingWhy AI-native analytics changes everything.
Studies every visitor
It looks at each person the way you would if you had the time. What they came for, what they read, what they ignored, and what that means for a business selling what you sell. Not a click count. An understanding of the person.
Before: you clicked through sessions one at a time, guessing.
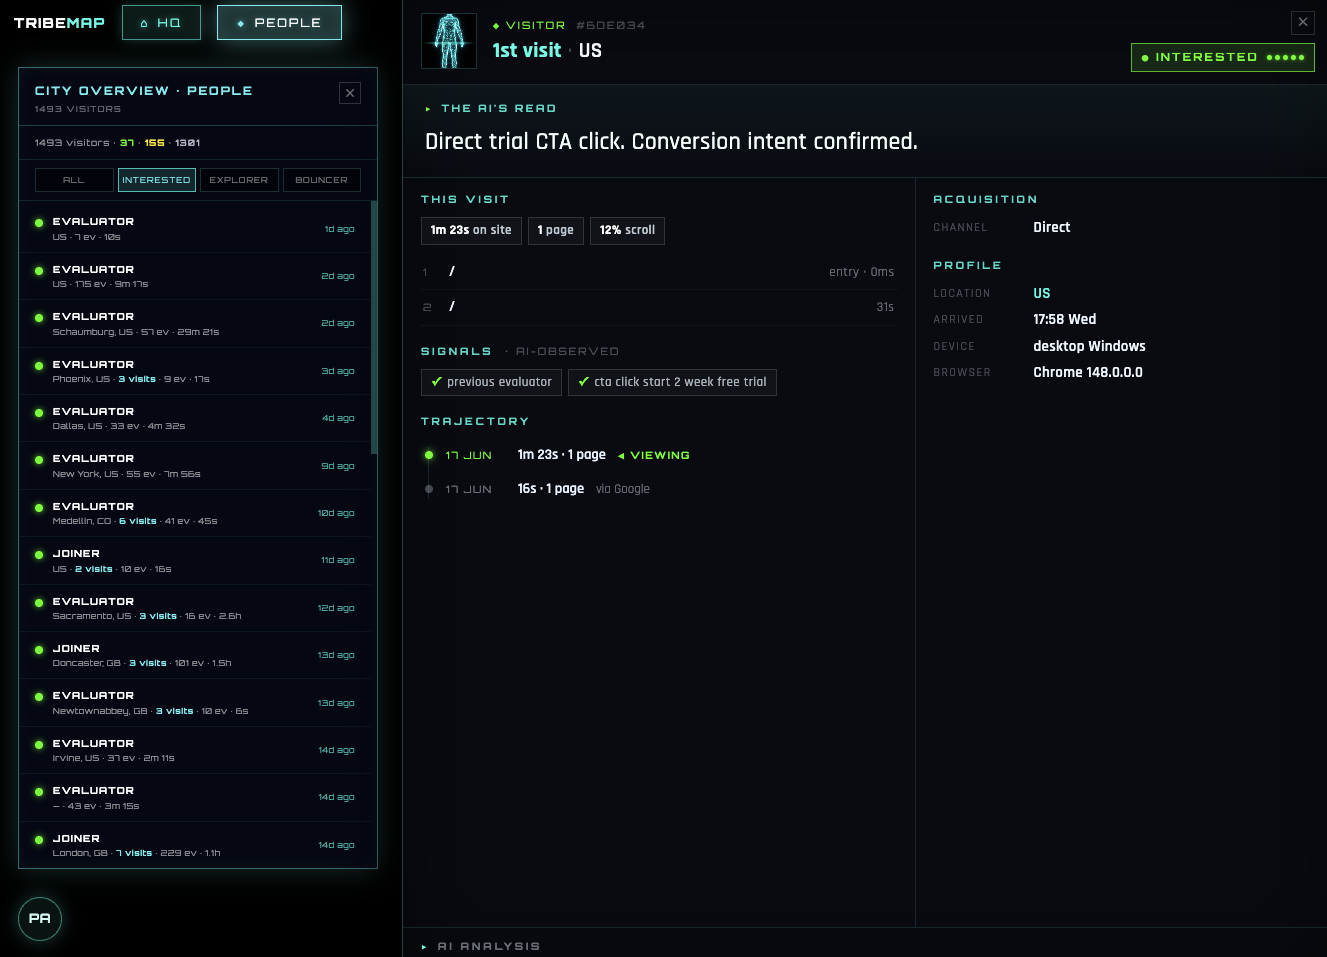
Judges every visitor
Each visitor walks out with a verdict, buyer, browser, or waste of time, and the reasoning behind it. Click any one and see why. The numbers you act on are people.
Before: bounce rate. A percentage that never told you who cared.
Tells you what’s working
Tells you which ad, post, page and channel actually brings real buyers. It tells you where you should double down.
Before: you guessed, then had to defend the guess.
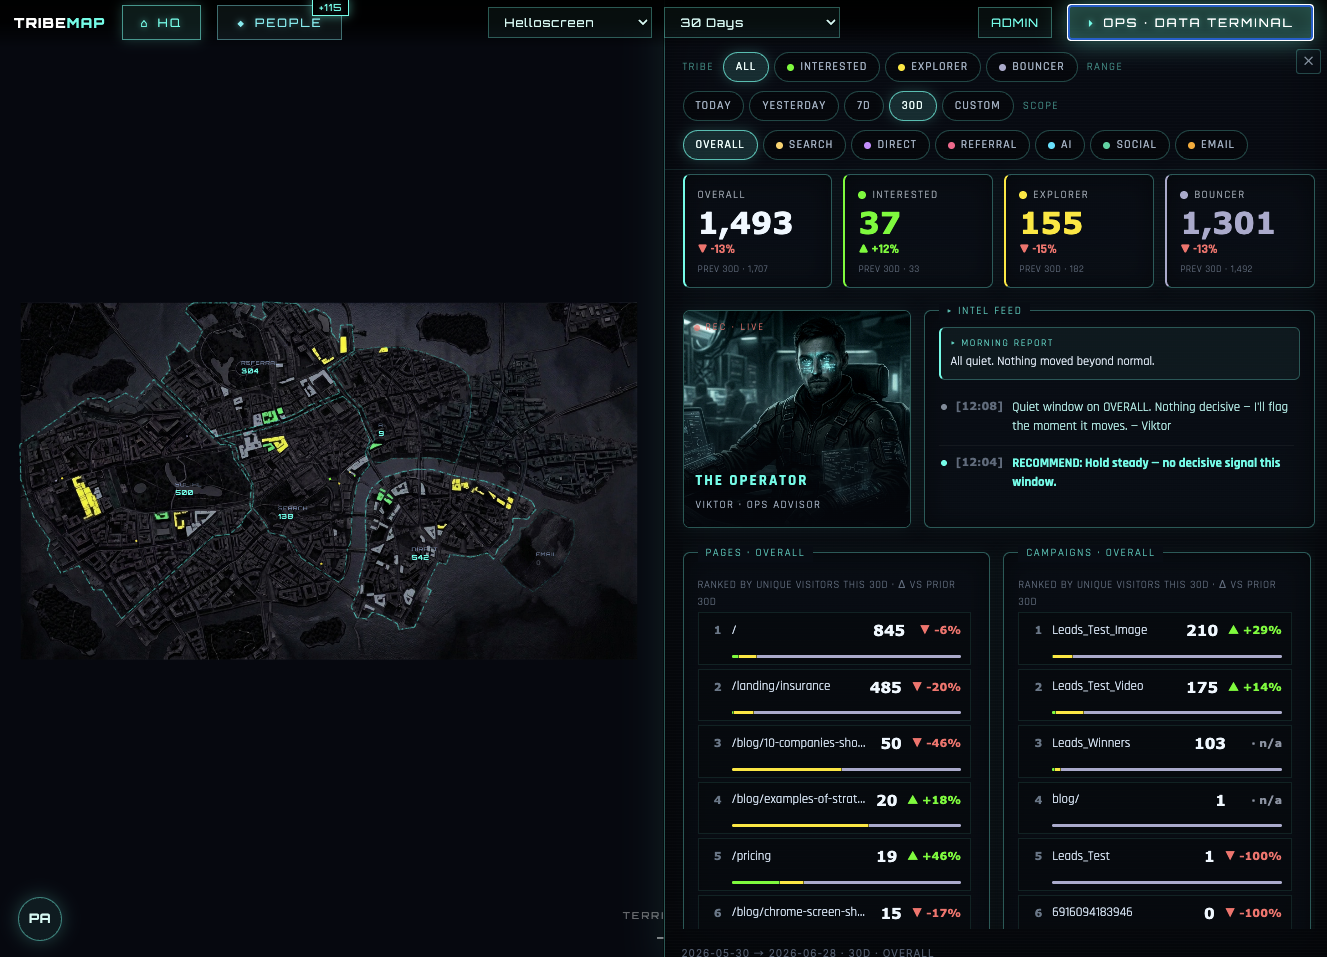
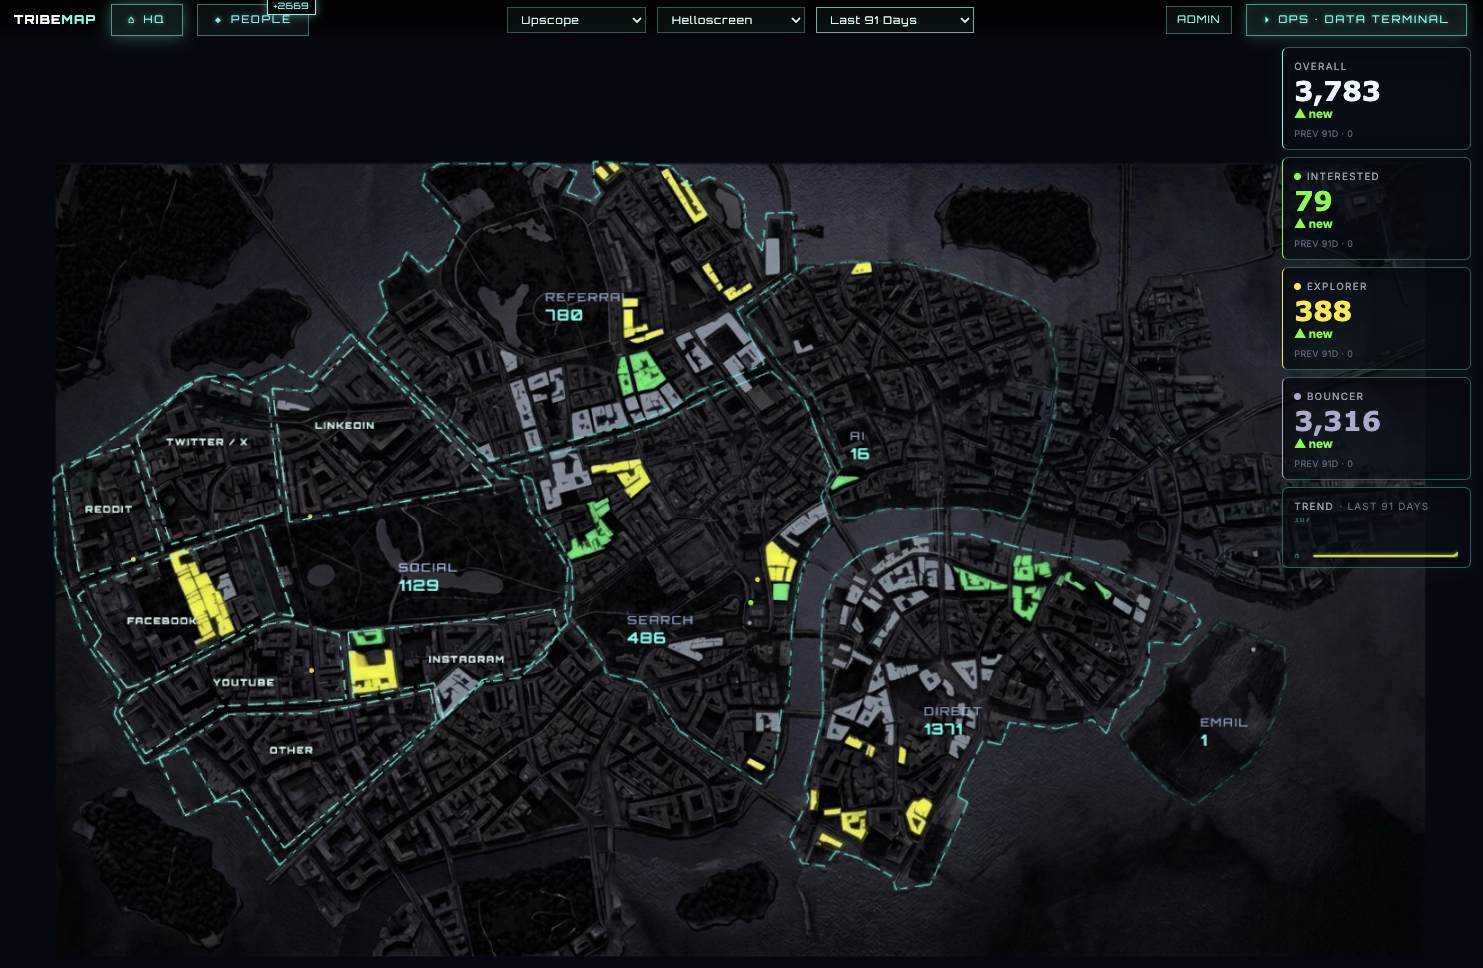
Shows you on a map
Those judged are placed on a beautiful map. Green are high buying intent, yellow are tourists, grey are the ones who bounce and do not care. Yes, there are dashboards too if you want them.
Before: dashboards, tabs, and a date-range picker.
Writes your morning report
At 7:00: what changed, which ads and posts brought real prospects, and what to do about it today. A deeper report every week. The report does analysis that would normally take hours. It will surprise you every day.
Before: you worked it out yourself. Or you did not.
Running by tomorrow morning
STEP 1 · TODAY
Paste one snippet
One line of code, installed in minutes. No tag manager archaeology, no data team.
STEP 2 · TONIGHT
The AI reads your visitors
Every visitor, one by one. Verdicts handed down, channels scored, the map lit. No PII, ever.
STEP 3 · 07:00
Your first briefing arrives
What happened, what mattered, what to do. From then on, every morning.
The no-brainer part
A real analyst costs $3,000 a month.
$49/mo
7-day free trial · one snippet · cancel anytime · full pricing →
Launch once.
Miss nothing.
Put the snippet in before launch day, and watch the map fill live.
Get the map7-day free trial · cancel anytime