Can I use ChatGPT or Claude to analyse my Google Analytics?
Short answer
Yes, and for one-off questions it works well. Export or screenshot the report, paste it in, ask your question. It breaks down on anything recurring, because you re-export every time, and because the assistant only ever sees the aggregate you handed it. It never sees an individual visitor's journey.
The screenshot workflow, and why everyone does it
You open GA4. You find the report that looks closest to the question in your head. You take a screenshot of the chart, paste it into ChatGPT or Claude, and type something like "what does this tell me". Then you read the answer, and it is more useful than the report was.
Almost everyone doing marketing on a small team has done this. It is not a hack and it is not a sign that you are bad at analytics. It is a completely reasonable response to a real situation: the numbers are sitting right there, you can see them, and the thing standing between you and an answer is not access to data but the effort of interpreting it. An assistant that will read a chart and talk to you about it in plain English removes exactly that friction, for free, in about fifteen seconds.
So this article is not going to tell you to stop. For a good number of questions, it is the right tool and nothing else is worth the setup. What it is going to do is be precise about the line: which questions this approach answers well, which ones it answers badly while sounding confident, and which ones it structurally cannot answer no matter how good the model gets.
That last category is smaller than the sceptics claim and more important than the enthusiasts admit.
What it is genuinely good at
Four things, and they are not trivial ones.
Explaining what a metric actually means. GA4 renamed, redefined or quietly changed a lot of the vocabulary people had spent a decade learning. Engaged sessions, key events, the difference between users and active users, what exactly gets attributed to a session that spans midnight. An assistant will explain any of these clearly and, in my experience, correctly. This alone is worth the paste.
Spotting the obvious thing you were staring past. Paste a channel breakdown for last month against the month before and ask what changed most. You will usually already know the headline. What you get for free is the second and third item, the ones outside the part of the chart you were looking at.
Turning a report into something a human wants to read. The monthly update for a founder or a client is a genuine chore, and it is mostly translation rather than analysis. An assistant does it well, fast, and in whatever register you ask for.
Suggesting where to look next. Not answering the question, but listing the checks that would narrow it down. This is the underrated one, because it is the part people skip when they are tired.
A worked example, because the quality of the answer tracks the quality of the prompt more than people expect:
I run a B2B SaaS selling project management software to
agencies, at roughly $50 a seat. Below is a GA4 channel
report for the last 28 days against the previous 28,
exported as CSV.

[paste the CSV here rather than a screenshot]

Three things, in order.

1. Which of these changes are large enough to be worth
   explaining, and which are inside normal variation for
   numbers of this size? Say which is which explicitly.
2. For each change worth explaining, give me the two or
   three most likely causes.
3. For each cause, tell me what I would need to look at
   in GA4 to confirm or rule it out.

Do not speculate about causes I cannot check with the
data I have. If something cannot be determined from this
report, say so.
Four things are doing the work there. Telling it what the business sells, so it can reason about what a good outcome looks like instead of treating traffic as an end in itself. Pasting CSV rather than an image, so the numbers are read exactly rather than inferred from a picture of a bar chart. Asking it to separate signal from noise before explaining anything, which is the step that stops it building an elaborate story on top of a 4% wobble. And explicitly licensing it to say "cannot be determined", which it will otherwise avoid.
Do that and the output is genuinely good. If you take one thing from this article and never buy anything, take that prompt.
Where it breaks down
Three failure modes, in increasing order of how much they matter.
It does not persist. Every week you do the export again, paste it again, and re-explain the context again. The assistant has no memory of last month's numbers unless you paste those too. This is an annoyance rather than a flaw, but it is the reason almost nobody keeps this up. The workflow dies about four weeks in, quietly, and what killed it was tedium.
A screenshot throws away most of the data. A chart is already a lossy summary of a table, and an image of a chart is a lossy rendering of that. The assistant is reading values off a picture. It will do this surprisingly well and it will occasionally get a number wrong, and you will not notice which. Exporting CSV from GA4's exploration interface takes about thirty seconds longer and removes this entire class of error. If you do nothing else differently after reading this, stop pasting screenshots and start pasting CSV.
And the one that actually matters: the assistant only ever sees what you already averaged. By the time a number reaches a GA4 report it has been through an aggregation. Sessions have been counted, durations have been averaged, visitors have been bucketed into channels. What arrives in the chat window is the summary, not the behaviour. The assistant is reasoning about a pile of totals, and it is very good at reasoning about a pile of totals, which is precisely why the answer sounds so much more solid than it is.
That diagram is the whole argument in one picture. On the left is what a traffic tool hands you and what you therefore paste: 1,482 sessions, 3,910 pageviews, 47 seconds average duration, 62% bounce rate. Every one of those is accurate. Not one of them says anything about a person. On the right is the other shape of output: one line per visitor, each a verdict about that individual, one who converted after reading pricing twice, one showing strong intent on a third visit, one browsing with no buying signal, one who left instantly. Same underlying behaviour, different unit, and only the second one answers who was worth your time.
The limitation nobody mentions
Here is the sentence that took me too long to work out.
You can hand the smartest model in the world a table of session counts by channel, and it still cannot tell you which visitor was worth your time. Not because it is not clever enough. Because that information was destroyed before the export.
A model can only reason about what is present in what it is shown. When 1,482 individual journeys were collapsed into a row that says "Organic search, 1,482 sessions, 62% bounce", the person who read your pricing page three times that week and the person who bounced off a blog post in four seconds both became one unit in the same total. That collapse is not reversible. No prompt recovers it, because there is nothing left to recover. This is a data problem, not a model problem, and the two get confused constantly because a better model does visibly improve the answers right up to the point where it cannot improve them at all.
I want to be fair about the edge here, because there is one. GA4 holds event-level data underneath the reports, and if you export the raw event stream you can, with effort, reconstruct individual journeys from it. People do this. It is a data engineering project rather than a paste, and once you have done it you still need something that reads each journey and reaches a consistent conclusion about it, every day, without you in the loop. That is a real path and not a cheap one. What it is definitively not is what happens when you screenshot a chart.
So the honest boundary. If your question is about volume, trend or composition, a report is the right input and the assistant will serve you well. If your question is about people, the report was the wrong input before you ever opened the chat window.
What to do instead
Two options, depending on which of those two problems you have.
If the workflow is the problem, automate the export. Connect the assistant to the GA4 Data API instead of copying and pasting. An MCP server pointed at that API is a workable do-it-yourself version and there are hosted tools that do the same job. Either way the assistant can pull the numbers itself, which means you can ask a follow-up without re-exporting anything, and the weekly ritual stops dying of tedium. Be clear about what this fixes and what it does not. It fixes the copy and paste. The data on the other end is the same aggregate it always was, so every limit in the section above is still there, just with less clicking. For a lot of teams that is genuinely the right stop, and you can leave the article here.
If the data is the problem, you need visitor-level behaviour and something that judges it. That is what TribeMap does. Every visit is classified into one of five tribes: joiner, who converted through a purchase, signup or other key action; evaluator, who showed strong intent through repeat visits and depth into the funnel; explorer, engaged across several pages with no conversion signal; browser, a light browse with fewer pages and lower depth; and bouncer, who left immediately with no engagement. Every classification records a confidence score and the reasoning that produced it, so you can open a verdict, read why it was reached, and disagree with it.
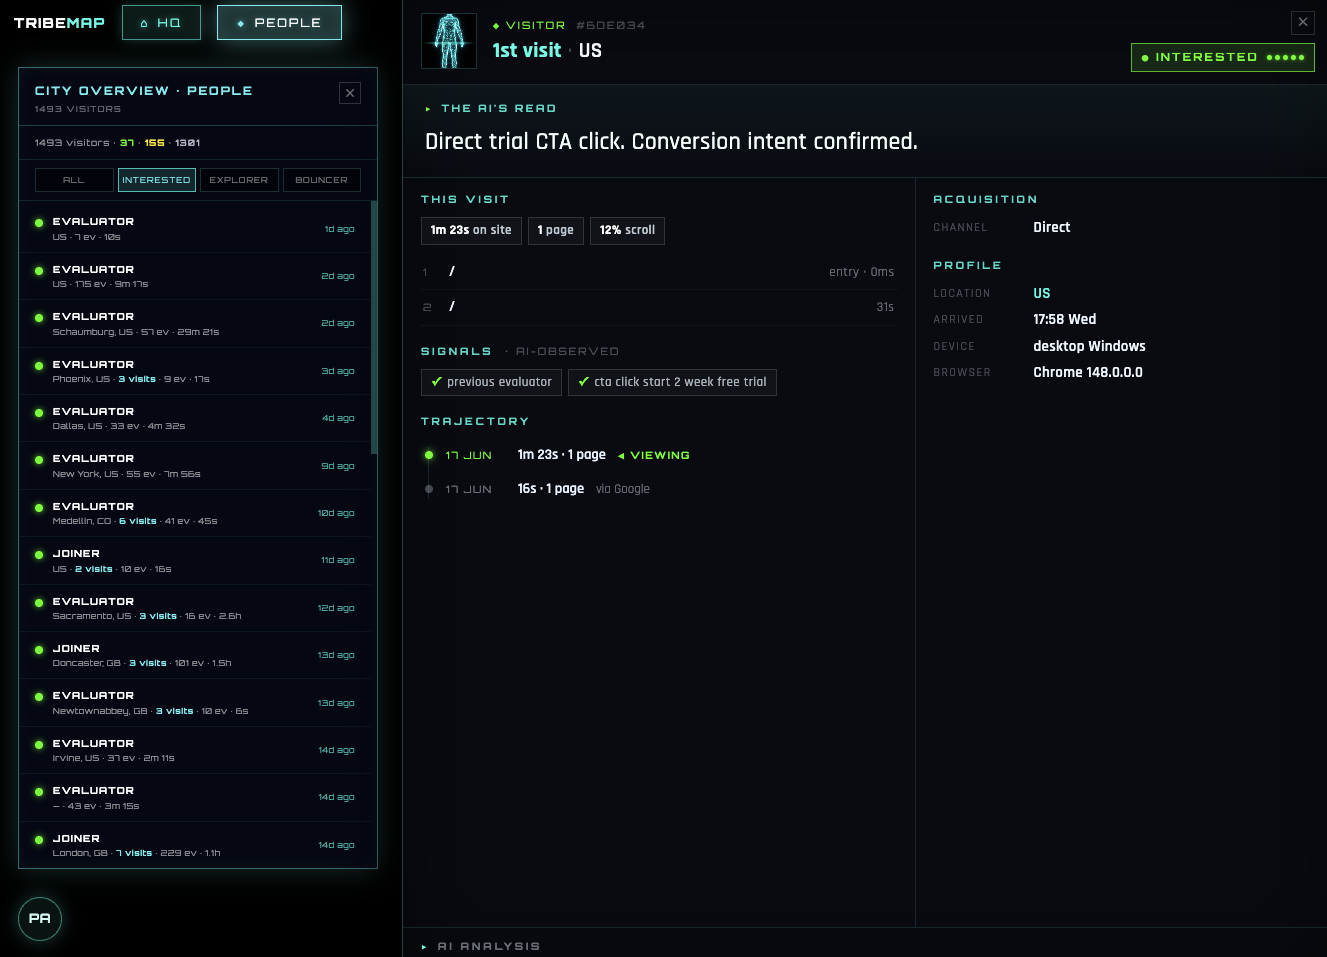
That is the artefact the paste-a-screenshot workflow can never produce. Not a better summary of the totals, but one visitor, the pages they actually read in the order they read them, the conclusion drawn about them, and the argument for that conclusion sitting next to it where you can check it.
What this looks like day to day
The five tribes collapse into three colours on the map. Green covers joiner and evaluator, yellow covers explorer and browser, grey is bouncer. That collapse is for reading speed, and the full five-way split is one click away in the detail view. Worth saying plainly, because it is the easiest thing to overclaim: green is not the same as buyers, since it includes evaluators who have bought nothing and may never. Green means the behaviour is consistent with someone seriously considering what you sell.

Those visitors sit in six territories, which are the six ways people arrive: Search, LinkedIn, Email, Social, Direct and Referral. You set the time range you care about, and today updates in realtime. The point of arranging verdicts as terrain rather than as a table is what it makes obvious without being asked: a big territory sending mostly grey is expensive noise however good it looks in a traffic report, and a small territory that is mostly green is worth defending. Nothing to export, nothing to paste, and the comparison lands in about three seconds.
Underneath it, the job is closing the gap on three things: WHO converts, which is product and market fit; WHERE they are reached, which is channel; and WHAT moves them, which is message. Setup is one script tag. No personal information is collected and input values are never stored, so what you get is a judgement about behaviour rather than a file on a named human being. Pricing is $49 a month, with a 7-day free trial.
And the honest close, because this would be a poor article if it ended on a pitch. You will still open GA4. Attribution reporting for your ad platforms lives there, historical comparisons live there, and when a count really is the right answer a counter is the right tool. You will probably still paste the occasional export into an assistant too, and you should, because for the four things in the second section nothing beats it. What changes is that you stop asking that workflow a question it was never able to answer. The longer version of the argument is in AI analytics vs web analytics, and the fair comparison of everything else on the market is in the best AI analytics tools.
One last limit that applies to all of it: a verdict is a judgement under uncertainty, not a fact. Any model reading behavioural signals will sometimes call a serious buyer a browser and occasionally be confident about it. Treat one verdict as a signal worth checking and the pattern across hundreds as evidence worth acting on.
Frequently asked questions
How do I get my Google Analytics data into ChatGPT or Claude?
The three practical routes are a screenshot of the report, a CSV export from the GA4 exploration interface, or the GA4 Data API if you are comfortable writing a script. Screenshots are quickest and lose the most detail. The API is the only one that scales.
Is it safe to paste analytics data into an AI assistant?
Aggregate traffic data is usually low risk, but check your provider's data-retention settings and your own policies first. Never paste anything containing personal information about identifiable visitors.
Why does the AI give vague answers about my analytics?
Because you handed it vague data. A screenshot of session counts by channel contains no information about what any individual did, so the assistant can only restate the totals back to you in a more readable form. The limitation is the input, not the model.
Can AI predict which visitors will convert from Google Analytics data?
Not from a standard report, because that report has already averaged the individuals away. Prediction at the visitor level needs visitor-level behavioural data, which is a different pipeline rather than a better prompt.
Is there a way to connect analytics to an AI assistant permanently?
Several tools now offer natural-language querying over your analytics, and an MCP server pointed at the GA4 API is a workable do-it-yourself version. Both remove the copy and paste. Neither changes the fact that the underlying data is aggregate.